You may have often heard it banded around over the last couple of years that Gold is an "Inflation Hedge" against unforeseen disasters since physical gold is one of the few investments that is not simultaneously an asset and someone else's liability. In other words as it’s a real asset, where the total quantity can’t easily be altered, it keeps its true purchasing power. Unlike paper money which can be magic out of thin air (and is at this very moment).
It has often be quoted that a pair offhand crafted quality sandals during the Roman Empire cost an half an ounce of gold, which is very similar to the price of ladies must have designer shoes today, coincidence? With all the talk about the inflation adjusted price (also called the real price) of gold reaching levels we haven't seen since the 1980 peak. I thought that I would investigate the subject from a UK inflation hedge perspective.
As gold like all commodities are traded in US Dollars. So for any non US investor it immediately apparent whether it’s value has really increased decreases or stayed the same in your local terms. The average price of a troy ounce (which is equal to 31.1034768 grams and 1.09714 avoirdupois / imperial ounces) in 2010 was US $1,224 and GB £792.
The annual average price of gold for most major currencies is published by the World Gold Council at www.gold.org/investment/statistics/prices. Taking this data and adjusting it for the affect of inflation by converting the price equitant in 2010 US Dollars and 2010 GP Pounds Stirling you get the results shown in the graph below (using the All Urban Consumers (CPI-U) from the US Department Of Labor for the US inflation and the Retail Prices Index (RPI) all items, from the UK Office of National Statistics for the UK inflation).
 |
| Inflation Adjusted Gold Price in GB Pounds and US Dollars since 1948 |
The doted lines are the unadjusted annual average gold price, and the sold lines are the inflation adjusted gold price. The first thing that becomes obvious is that the piece gold bottomed out at during the late 1990’s was pretty close to the inflation adjusted price in the 1950’s and 1960’s for both $’s and £’s. The second thing that you notices is that in the 1950’s and 1960’s the gold prices was virtually the same in Dollars and Pounds (parity), until the early 1970’s, where upon they diverged. From that time onwards the Pound value is always lower than the Dollar value. These observations can be seen easier when the inflation adjusted gold price is index from 1950, as illustrated in the in chart below.
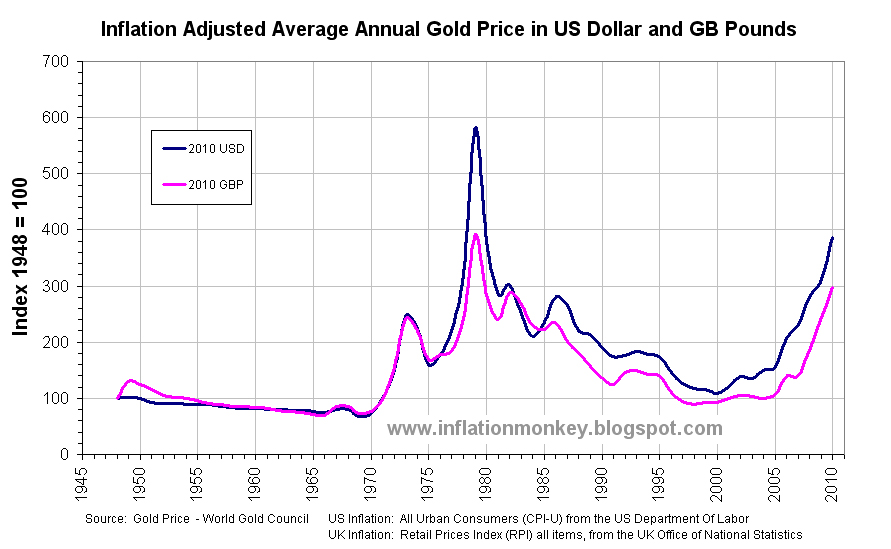 |
| Inflation Adjusted Gold Price in GB Pounds and US Dollars. Indexed from1948. |
As indexed data highlights the compounded yearly changes really well, those observations now become very clear. The next question that springs to mind is why did the inflation adjusted price of gold start off at parity in Dollars and Pounds and then why did it diverge? It must be remembered that the exchange rate between the £ and $ use to be much greater then it is at present (£1 ~ $1.60).
Food for thought don’t you thing? I’ve have to see is I can find UK inflation rate date back to the 1900’s, too see what the inflation adjusted gold price was in Pounds back during the 1920’s and 1930’s. The last big credit boom and bust that everyone keep refereeing to!
Written by Inflation Monkey. Join on Google+.
No comments:
Post a Comment